Create Interactive Report
Interactive reports enable you to create a customized report.
Gotransverse is in process of deprecating the current Interactive reports option. As part of this process, the use of Interactive reports will be limited to currently contracted customers who have actively used these reports between January 1, 2024, and June 1, 2024.
For more information about reports, refer to the Knowledge Base article Interactive Reports.
Complete the following steps to create an interactive report:
-
Select Standard Reports or Reporting from the Gotransverse application menu
 to open the reporting tool.
 -
From the Home window, click Create New, and select Interactive Report to open the Select Data Source window.
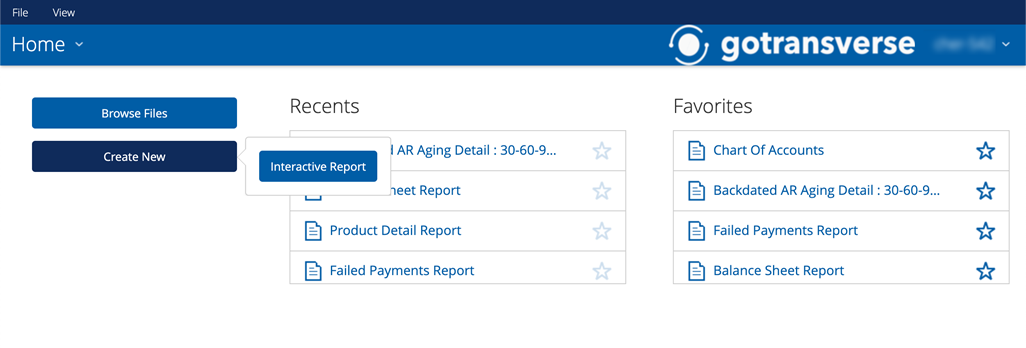
Create New Interactive Report
-
On the Select Data Source window select a data source, then click OK. A blank Interactive report canvas displays.
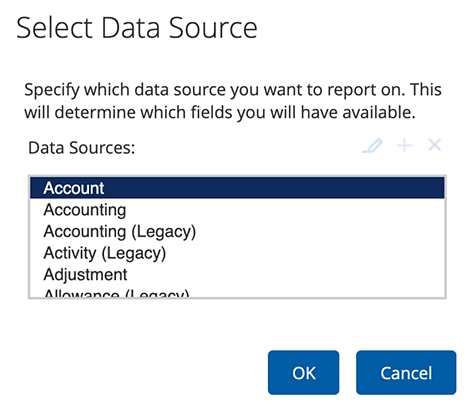
Select Data Source Window
-
On the Report Canvas, rename your report by double-clicking Untitled and enter a name in the field that displays.
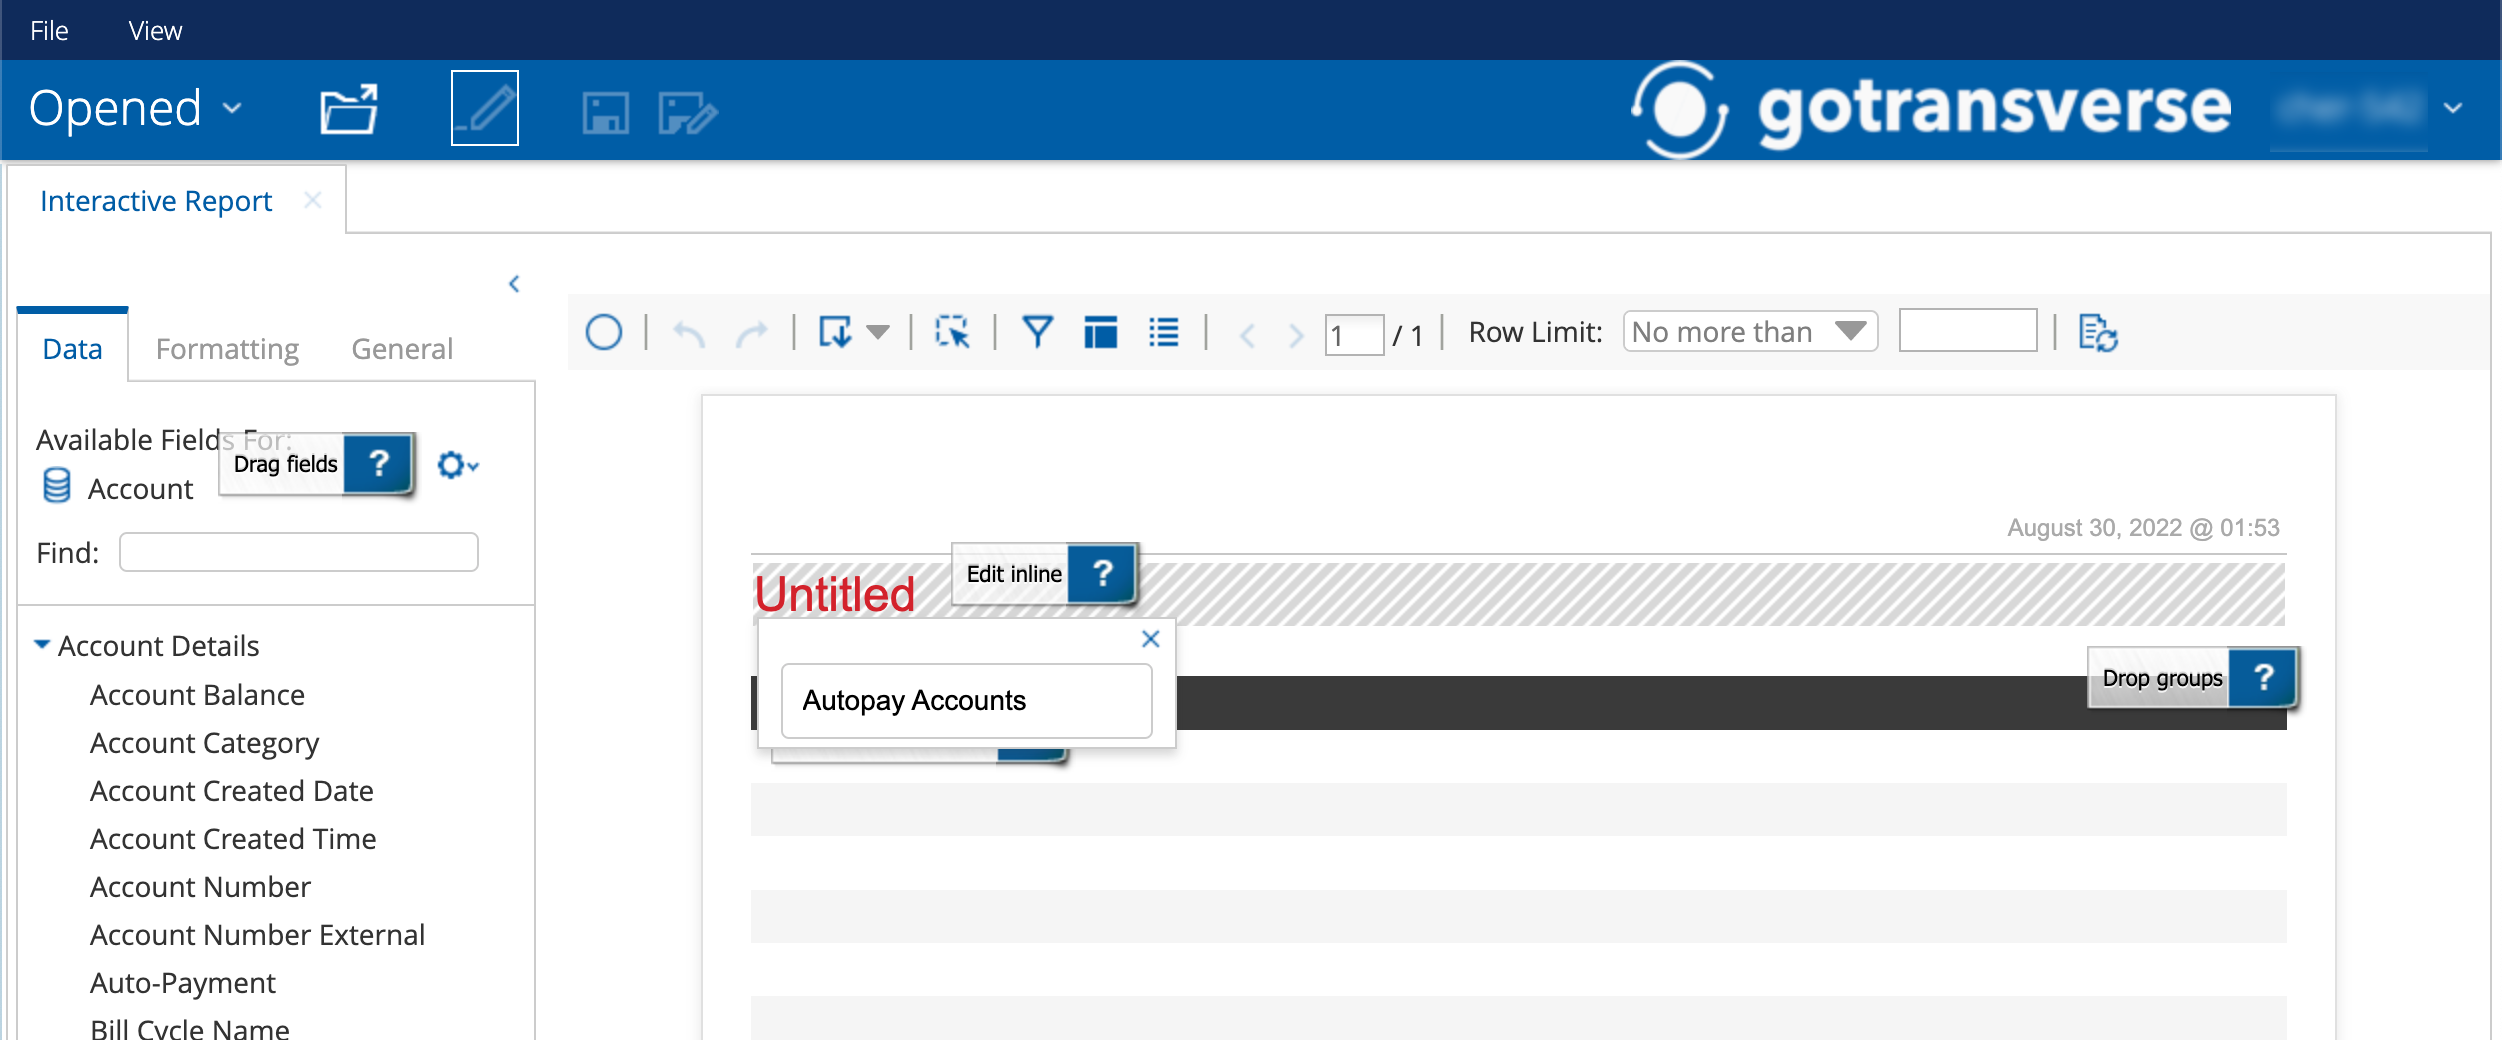
Rename an Interactive Report
-
Drag and drop data elements onto the canvas. The data from the chosen fields appears on the report canvas and populates with the information from the server. You can change the order of the columns by clicking the column heads and dragging the columns left or right until they are in the order you want. If you want to delete a column, drag and drop the column title into the trash can.
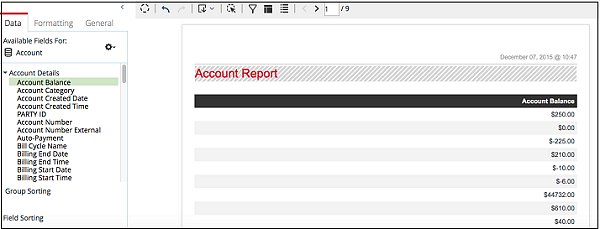
Add a Column to Interactive Report
-
After you have arranged your columns in order, apply a filter to the data by clicking on the Filter icon in the toolbar. After the filter pane expands, drag an element field onto the filter workspace. The Filter on... window opens.
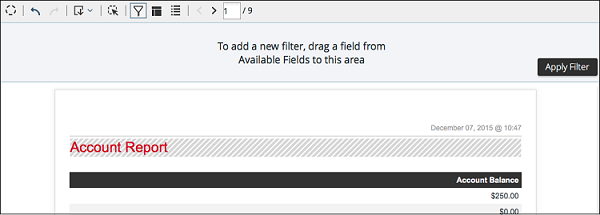
Filter Button
-
On the Filter on... window, click the Select from a list radio button.

Filter on Account Balance Window
-
Select items from the Filter list by using one of these methods:
-
Click on the arrows to move your selected filters on to or off of the Filter list.
-
To select more than one item from the Filter list, hold down the CTRL key and click the items that you want to filter by, then click the top arrow to move the items to the right panel.
-
Or you can select a series from the list by holding down the Shift key and clicking on the first item you want to use, then clicking on the last item that you want to use.
-
Select individual items by clicking to highlight them and then clicking on the top arrow to move it to the right panel.
-
-
Click OK. The Filter on... window closes, and the data in the report is filtered.
-
Click the Save As button in the toolbar to save the report to open the Save As window.
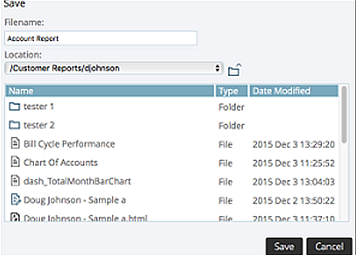
Save Window for Interactive Report
-
Save your report using a new title.
-
Select your user folder as the location, and click Save.
If you want to export the report, click the Export icon on the toolbar and choose a format from the drop-down list. The report exports in the selected format and a paper copy can be printed.